Northcott Global Solutions
Interactive mapping and operational data
Built major parts of a React and TypeScript operational platform, including a custom Google Maps interface for drawing, editing and working with live geographical data.
Role
Frontend Developer
Period
Jan 2023 – Feb 2024
Company
Northcott Global Solutions
Overview#
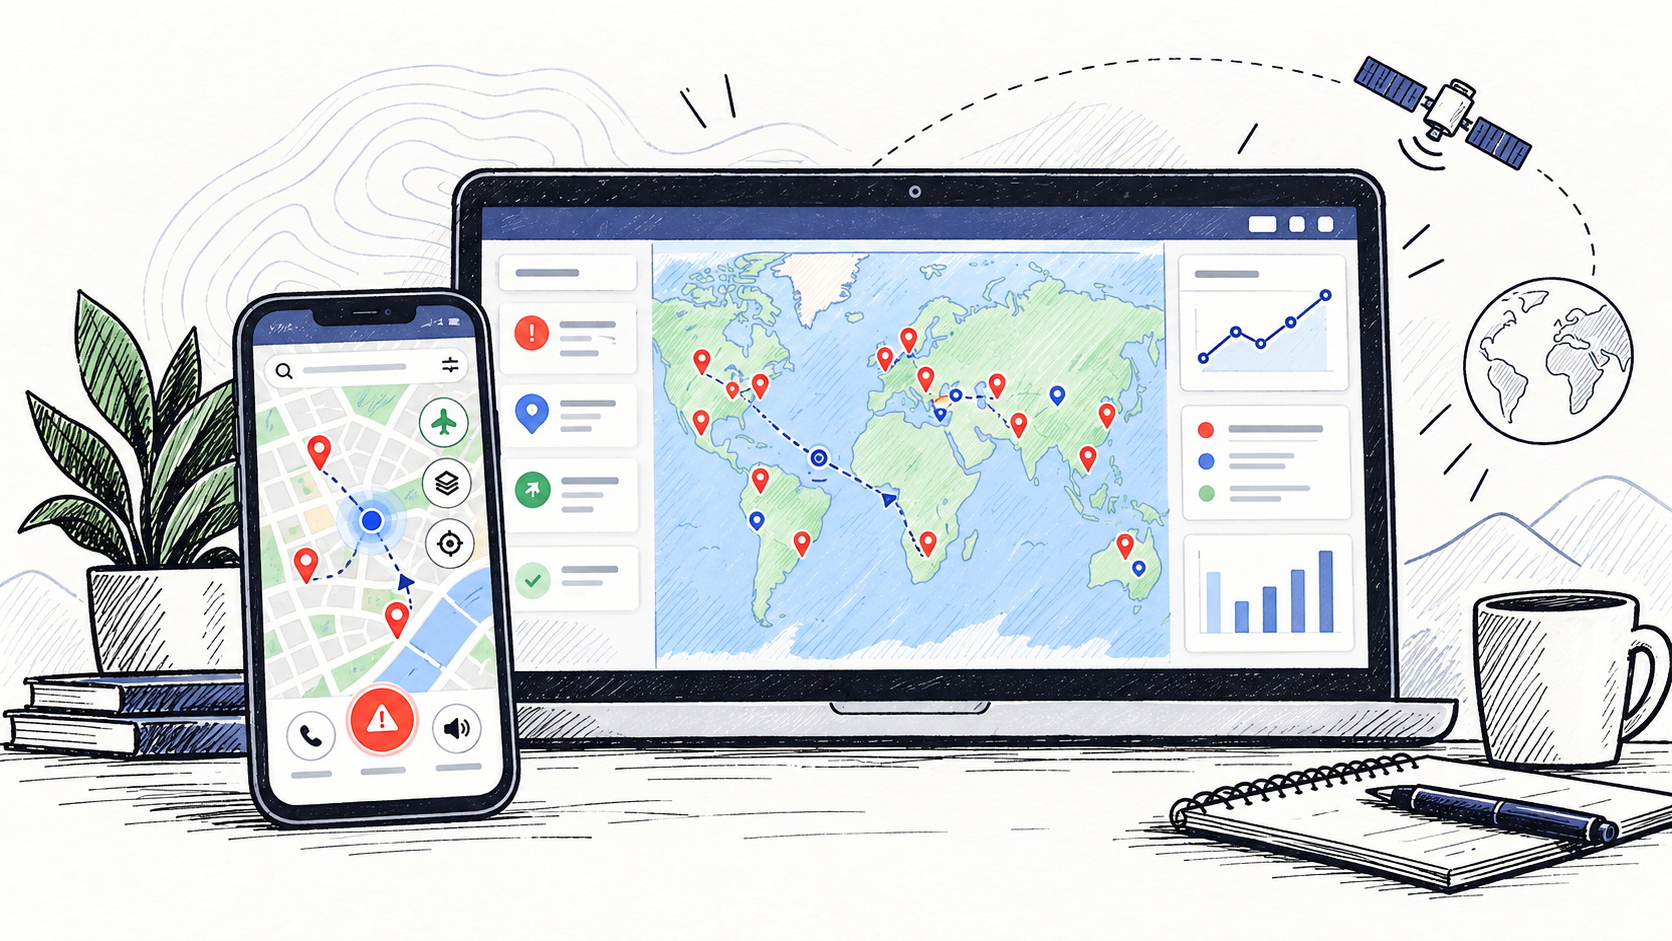
At Northcott Global Solutions, I worked on a data-heavy operational platform built with React and TypeScript. A large part of the product centred around geographic data, with Google Maps used to visualise locations, operational information and user movement directly within the application.
The frontend needed to handle both conventional application state and server-driven operational data while remaining responsive as information changed. My work covered interactive mapping, typed data access, cache synchronisation, routing and near-real-time tracking.
The code examples below are simplified representative examples based on the patterns I used in the project rather than copies of the original production source.
Building the frontend around domain-specific data#
I organised server-state logic around domain-specific modules instead of placing API requests directly inside presentation components.
For example, I created an incidents.ts module containing a typed useIncidents hook that exposed operations for retrieving, updating and deleting incidents.
// incidents.ts

export function useIncidents() {
  const getIncidents = () => {
    // TanStack Query query
  };

  const updateIncident = () => {
    // TanStack Query mutation
  };

  const deleteIncident = () => {
    // TanStack Query mutation
  };

  return {
    getIncidents,
    updateIncident,
    deleteIncident,
  };
}
A component could then consume the domain logic without needing to know how the request itself was implemented.
const {
  getIncidents,
  updateIncident,
  deleteIncident,
} = useIncidents();

const incidents = getIncidents();

if (incidents.isLoading) {
  return <LoadingState />;
}
TypeScript was integrated into this layer so incident data and mutation inputs had consistent types as they moved between the API and the interface.
type Incident = {
  id: string;
  title: string;
  status: IncidentStatus;
  latitude: number;
  longitude: number;
};

type UpdateIncidentInput = {
  id: string;
  status?: IncidentStatus;
};
This helped keep components focused on rendering and interaction while the data-access behaviour remained reusable and centralised.
Keeping operational data in sync#
The same incident data could appear in multiple parts of the application, so keeping the interface synchronised after mutations was important.
I regularly used TanStack Query's queryClient.invalidateQueries() after operations such as updating or deleting an incident.
const queryClient = useQueryClient();

const updateIncidentMutation = useMutation({
  mutationFn: updateIncidentRequest,

  onSuccess: () => {
    queryClient.invalidateQueries({
      queryKey: ["incidents"],
    });
  },
});
The same approach could be used after deletion.
const deleteIncidentMutation = useMutation({
  mutationFn: deleteIncidentRequest,

  onSuccess: () => {
    queryClient.invalidateQueries({
      queryKey: ["incidents"],
    });
  },
});
Invalidating the query marked the cached incident data as stale and allowed the latest server state to be fetched again. This meant different parts of the interface could stay aligned without manually maintaining separate copies of the same server data.
Live tracking and route visualisation#
One of the more interactive features I worked on was live tracking.
When live tracking was enabled, the application refetched location data approximately once per second. As new coordinates were received, a path on the Google Map was extended to show the user's movement over time.
A simplified version of the query pattern looked like this:
const trackingQuery = useQuery({
  queryKey: ["tracking", userId],
  queryFn: () =>
    getLatestTrackingData(userId),

  refetchInterval: trackingEnabled
    ? 1000
    : false,
});
The polling was conditional, so the frequent network requests only happened while live tracking was enabled.
The incoming coordinates could then be transformed into a format suitable for the map.
const path = trackingData.map(
  (point) => ({
    lat: point.latitude,
    lng: point.longitude,
  }),
);
That path could then be rendered on the map.
<Polyline
  path={path}
/>
As new tracking data arrived, the path updated and visually represented the route the user had taken.
This connected several parts of the frontend stack together:
- TanStack Query handled repeated server-state updates
- TypeScript provided structure around the incoming tracking data
- React coordinated the UI state
- Google Maps visualised the changing coordinates as a live route
Interactive mapping#
The mapping experience was more than a static display of locations. Geographic information formed part of the wider operational workflow, with users able to work with location-based data directly inside the application.
A simplified position type could look like this:
type MapPosition = {
  lat: number;
  lng: number;
};

const position: MapPosition = {
  lat: incident.latitude,
  lng: incident.longitude,
};
Operational entities could then be represented directly on the map.
<Marker
  position={{
    lat: incident.latitude,
    lng: incident.longitude,
  }}
/>
Working on this required thinking about how API data, map state and React state should interact as the underlying information changed.
The challenge was not only displaying geographic data, but making it feel like a natural part of the product rather than a separate mapping tool.
Replacing a fragmented mapping workflow#
Before the mapping functionality was integrated directly into the platform, mapping work relied more heavily on external tools.
Bringing Google Maps into the application meant geographic information could be connected directly to operational data and the rest of the product workflow.
Instead of treating mapping as a separate task, users could work with location data in the same interface where the rest of the operational information was displayed.
This made the map part of the application architecture rather than an isolated visualisation.
Frontend architecture#
The platform was built with React and TypeScript, with TanStack Query used for server-state management and React Router used to structure the application's pages and nested routes.
A simplified routing structure could look like this:
<Route
  path="/incidents"
  element={<IncidentsLayout />}
>
  <Route
    index
    element={<IncidentList />}
  />

  <Route
    path=":id"
    element={<IncidentDetail />}
  />
</Route>
Shared layouts could render the active nested route using Outlet.
function IncidentsLayout() {
  return (
    <div>
      <IncidentsNavigation />

      <Outlet />
    </div>
  );
}
This was useful in a growing operational application where related screens shared navigation and layout while still having their own routes.
Working as the initial frontend developer#
For roughly the first six months of the project, I was the sole frontend developer.
That meant my work extended beyond implementing individual screens. I was also involved in establishing reusable frontend patterns, structuring pages and shaping how the client-side application was organised as the product grew.
Rather than working within an already-established frontend architecture, I had to make decisions about how different parts of the application should fit together.
This included areas such as:
- organising server-state logic by domain
- creating reusable React components
- introducing TypeScript throughout the frontend
- structuring nested routes
- handling loading and mutation states
- keeping cached server data synchronised
- integrating Google Maps with application data
- supporting near-real-time tracking
What I took from the project#
The project gave me experience working on a frontend where the main challenge was not simply rendering CRUD screens.
The application combined operational data, interactive maps, server-state management and near-real-time updates, which meant the frontend had to coordinate several different types of state while remaining understandable and maintainable.
It also gave me early experience taking ownership of a substantial frontend codebase and establishing patterns that could support the application as it expanded.
The most technically interesting part of the work was the relationship between live operational data and the map. Data was not only fetched and displayed — it could change frequently, affect multiple parts of the interface and be represented geographically in real time.